
Central venous pressure (CVP) or right atrial pressure (RAP) waveform tracings can oftentimes provide useful insight into a patient’s right ventricle (RV), tricuspid valve (TV), and overall cardiopulmonary status. The waveform morphology is easier to identify at slower heart rates and consists of three waves and two descents:
The waves generally represent filling or contraction, whereas the descents represent emptying or relaxation.
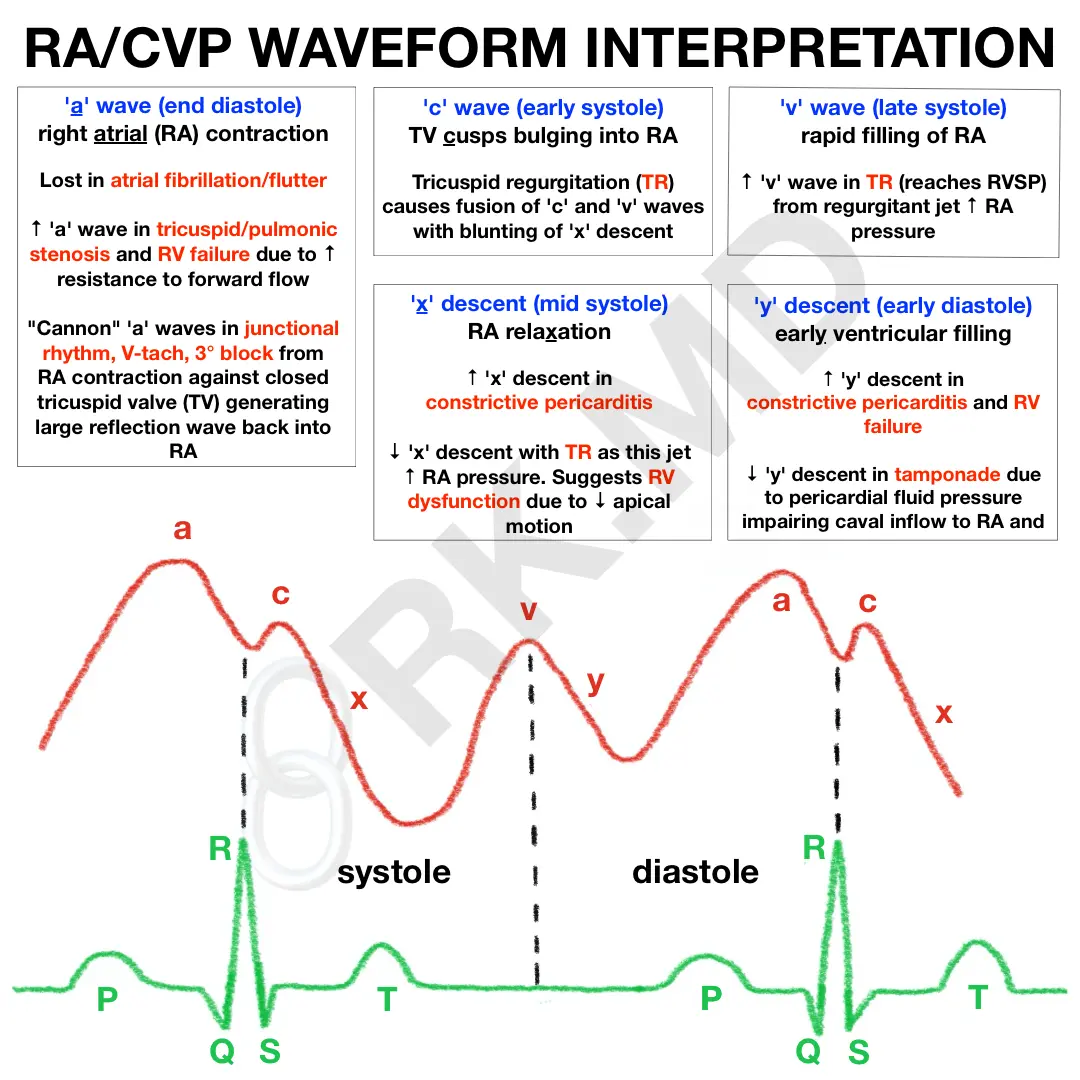
- ‘a’ wave (RA contraction at end-diastole): lost in atrial fibrillation/flutter due to disorganized atrial activity. ↑ in pathologies that impede forward flow like tricuspid/pulmonic stenosis and pHTN. Classic “cannon waves” caused by RA contraction against a closed TV causing reflection wave back into RA (junctional rhythm, V-tach, third-degree block)
- ‘c’ wave (TV cusps bulge into RA during early systole): c-v wave fusion and blunting of ‘x’ descent with TR
- ‘x’ descent (RA relaxation in mid systole): ↑ in constrictive pericarditis (CP), ↓ with TR (jet ↑ RAP) and RV dysfunction due to ↓ downward movement of RV
- ‘v’ wave (rapid filling of RA in late systole). ↑ in TR from regurgitant jet ↑ RAP. Similar tracings are obtained for LEFT atrial pressures (↑ ‘v’ wave with mitral regurgitation). The ‘v’ wave can gauge the success of mitral valve repair (e.g., MitraClip).
- ‘y’ descent (rapid RV filling in early diastole) Steep ↑ with constrictive pericarditis and ↓ with tamponade (↓ RV filling from ↓ caval inflow).
Drop me a comment with your thoughts and questions!


Great post doc. Very few good resources for invasive hemodynamic assessments. Would be great to add what constrictive, restrictive physiology looks like as a separate graph as well to make it even more thorough. Keep up the great work
Appreciate the comment and suggestion man! I’ll look into it!
Thank you for the diagram!
I am currently making a lecture on hemodynamic monitoring and I’ve found that, while these graphs are great and certainly form a nice conceptual basis, it becomes more difficult when you are at the bedside and applying the knowledge to real time interpretation.
I’ve searched google up and down and cannot find any decent examples of atrial waveform/CVP on monitors (Deranged Physiology has one or two). I think having something like this would be a nice addition to the diagram! Thanks for all the work.
Excellent suggestion – if I come across such an example, I’ll include it!
Not sure if the QRS is labeled erroneously in your diagram.
Thank you so much – I’ve corrected it in the diagram!
Thank you for the teaching diagram. I am just confused about why constrictive pericarditis would have increased x and y descent. I am thinking they would be decreased because of the restrictive pressure and inability to fill properly.
The sharp ‘y’ descent occurs due to ventricular filling which gets limited to only early diastole due to a stiff pericardium. Atrial relaxation remains relatively unchanged, but an exaggerated ventricular longitudinal contraction leads to the exaggerated ‘x’ descent during ventricular systole.
Thank you so much – MKSAP question and Curiosity brought me here.
Thank you for the explanation: MKSAP question describes; ACUTE STEMI and MR
”Jugular venous pulse is elevated and visible, with exaggerated x and y descents, and the estimated central venous pressure is 12 cm H2O. Bilateral crackles are noted. A soft, early systolic murmur with an S3 is audible in the apical area. An early diastolic rumble is present.”
Can you explain why Exaggerated X and Y Descents?
isn’t X systole? so not much blood be filling ventricle – Exaggerated Y – kinda makes sense as blood would rush down fast as valve has been ruptured?
per MKSAP: The murmur of acute mitral regurgitation may be present only in early diastole, owing to rapid diastolic equalization of ventricular and atrial pressures caused by the high volume overload. In cases of severe mitral regurgitation, a diastolic rumble occurs because of the large regurgitant volume during diastole
as I getting the concept right?
Rishi,
I just found your website. Great information and well put together. I am preparing a lecture on central lines and central venous pressure wave forms for our new anesthesia residency program. Would you mind if I use some of your material and reference your site for the residents?
Thank you,
Mike
Hey Mike! Yes absolutely, I’d love for you to share my materials.
Thank you for or very nice diagram.
Just one question: why were the elements of atrial wave named A, C, V, X descent and Y descent? Is there any glue to remember them correctly (for example: A wave for Atrial contraction).
Thanks Le! I actually have no idea where the letters came from. In the diagram, I underlined words that remind me of what the letter stands for (ie, the ‘c’ wave represents tricuspid valve cusps bulging into the right atrium). I couldn’t think of anything for the ‘v’ wave, so I just remember that these are the waves I monitor during MitraClip repairs to suggest that mitral regurgitation has improved.
What is the cause for Prominent X and Y descent in constrictive pericarditis? Also whats the cause for Prominent x wave in cardiac tamponade?
Very high yield infographic, thank you! Would love to share with our followers
Appreciate it, Gerald! Feel free to do so!
Hi! I’m a critical care nurse in Toronto, Canada and I’m wondering if I can use your diagram/infographic to help supplement the information about PA line tracings our new hires have to learn?
Thanks so much for all the teaching that you do!
Hello Flavia! I’d consider it a great honor if you use this diagram for such a purpose. Thank you in advance, and please let me know if you or your new hires have questions! 🙂