
Continuous capnography (measurement of carbon dioxide) is the gold standard for confirming endotracheal tube placement but is also utilized in the operating room and intensive care unit (ICU) to help guide ventilation in conjunction with blood gases.
The shape of a capnogram can provide valuable insight into pulmonary obstruction (and compliance to a certain degree). The difference between measured arterial CO2 (PaCO2) and end-tidal CO2 (ETCO2) from the capnogram gives us an idea about alveolar dead space. ETCO2 can be related to changes in metabolism, pulmonary embolism (increased dead space), or the evolution of pulmonary pathologies like pneumonia and acute respiratory distress syndrome (ARDS).
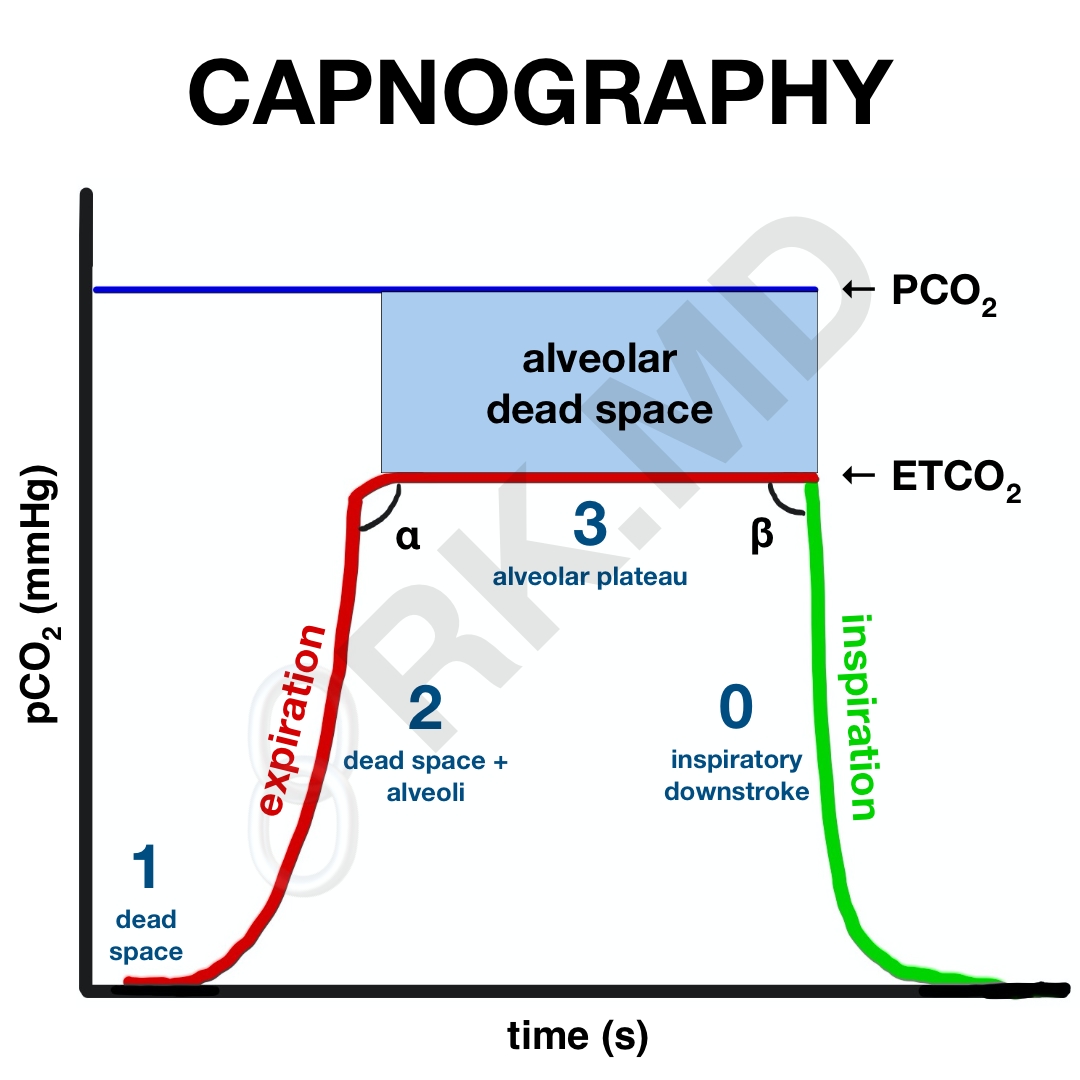
Let’s look at a capnogram. In the following illustration, red and green represent the expiratory and inspiratory phases of respiration, respectively. Initially, during expiration (phase 1), gases from the conducting zones (oro/nasopharynx, trachea, proximal bronchi) are exhaled first. This gas has a composition similar to that of the atmosphere, and consequently, does not contain much CO2. Because these regions are not involved in gas exchange, it is termed anatomic dead space.
Phase 2 is a slow upstroke where exhaled gas is now starting to include CO2 from alveoli. Alveoli have varying compliances and degrees of ventilation. For example, alveoli in the lung bases tend to be better ventilated (and perfused, for that matter) compared to alveoli in the apices. Ultimately, the alveolar plateau is reached (phase 3), representing continued exhalation of CO2-rich alveolar gas. Sometimes phase 3 has an upstroke representing expiratory obstruction as classically seen in chronic obstructive pulmonary disease (COPD). The very end of phase 3 marks the ETCO2. The capnogram then sharply drops off to indicate inspiration since no additional CO2 is exhaled.
Now, what about the angles? Without too much complexity, the α-angle is related to fast and slow alveoli distribution. An angle > 90 degrees (upstroke in phase 3) suggests a worsening V/Q mismatch. A β-angle > 90 degrees suggests that it takes more time for the CO2 to drop on inspiration (phase 0) which could suggest rebreathing of CO2.
Finally, alveolar dead space represents alveoli that are poorly perfused and therefore do not participate in gas exchange. If a patient has a lot of alveolar dead space, they cannot effectively unload CO2 on exhalation (decreased ETCO2) and will therefore retain more CO2 in the arterial blood (PaCO2). This means the PaCO2 – ETCO2 gradient will increase. Since we continuously measure ETCO2 but only check PaCO2 through arterial blood gases occasionally, it’s nice to establish this gradient’s size by drawing a blood gas and recording the ETCO2 at that exact time. The next time you look at the ETCO2, you’ll have a rough idea of what the PaCO2 is by adding the same gradient.
Drop me a comment below with questions! 🙂


why is the phase III reversed in slope in emphysema? thank you
In chronic obstructive pulmonary disease (COPD), the loss of lung elasticity makes it more difficult for patients to actual expire a tidal volume; therefore, more CO2 is exhaled over a longer period of time leading to a more gradual upward slope on the capnogram. The worse the obstruction… the steeper the slope.
What exactly is occurring at Phase 3? How can I have CO2 being released but not an increasing CO2 concentration.
Phase 3 is where you primarily have alveolar CO2 being expired as a steady state. Sometimes this phase has a positive slope suggesting that the peak expired CO2 is slowly being achieved over time due to having to overcome an obstruction (ie, patients with COPD or reactive airways).
What is considered normal for PaCO2-ETCO2 gradient?
Roughly 5 mmHg.
Couple questions here rishi:
Can EtCo2 tell whether the tube is selective after intubation. Heard someone say that the capnogramm suggests that sometime.
Second question: in laparoscopic procedures are there any details in particular one should pay attention to in the capnogramm
Not sure what you mean “whether the tube is selective”, and as far as after laparoscopic insufflation, you can expect the ETCO2 to rise. As a result, I usually start increasing the patient’s minute ventilation in anticipation for this increase in ETCO2 prior to insufflation.
Meant by that exclusive right lung ventilation when the tube is too deeply inserte without checking…. Happy new year Rishi
Oh yeah, you ‘ll have a lower ETCO2 if you’re mainstemmed. Also your airway pressures will be higher than normal as a large tidal volume intended for two lungs is delivered to only one.
can shunt also cause a big gap between et and paco2?
Let’s consider an example of shunt – selective ventilation of the right lung using a double lumen endotracheal tube (“one lung ventilation”, OLV). The left lung is no longer receiving any ventilation but is still being perfused until hypoxic pulmonary vasoconstriction (HPV), positioning, etc. reduce the shunt fraction to improve the V/Q mismatch by sending more blood to the ventilated right lung. What happens almost immediately when we go to one lung ventilation? The ETCO2 will drop while the PaCO2 remains what it was prior to lung isolation. With time and appropriate ventilator settings, this gap will once again narrow as more CO2 is released from the ventilated lung (ETCO2).
While dead space is a major consideration in the ETCO2 – PaCO2 gradient, the short answer is that shunt generally doesn’t significantly affect this gradient.