
The left ventricle’s (LV) pressure-volume (P-V) loop visually represents an important relationship between the chamber’s pressure and volume over a single cardiac cycle. In the following diagram, systole is red, and diastole is blue. The P-V loop consists of four events:
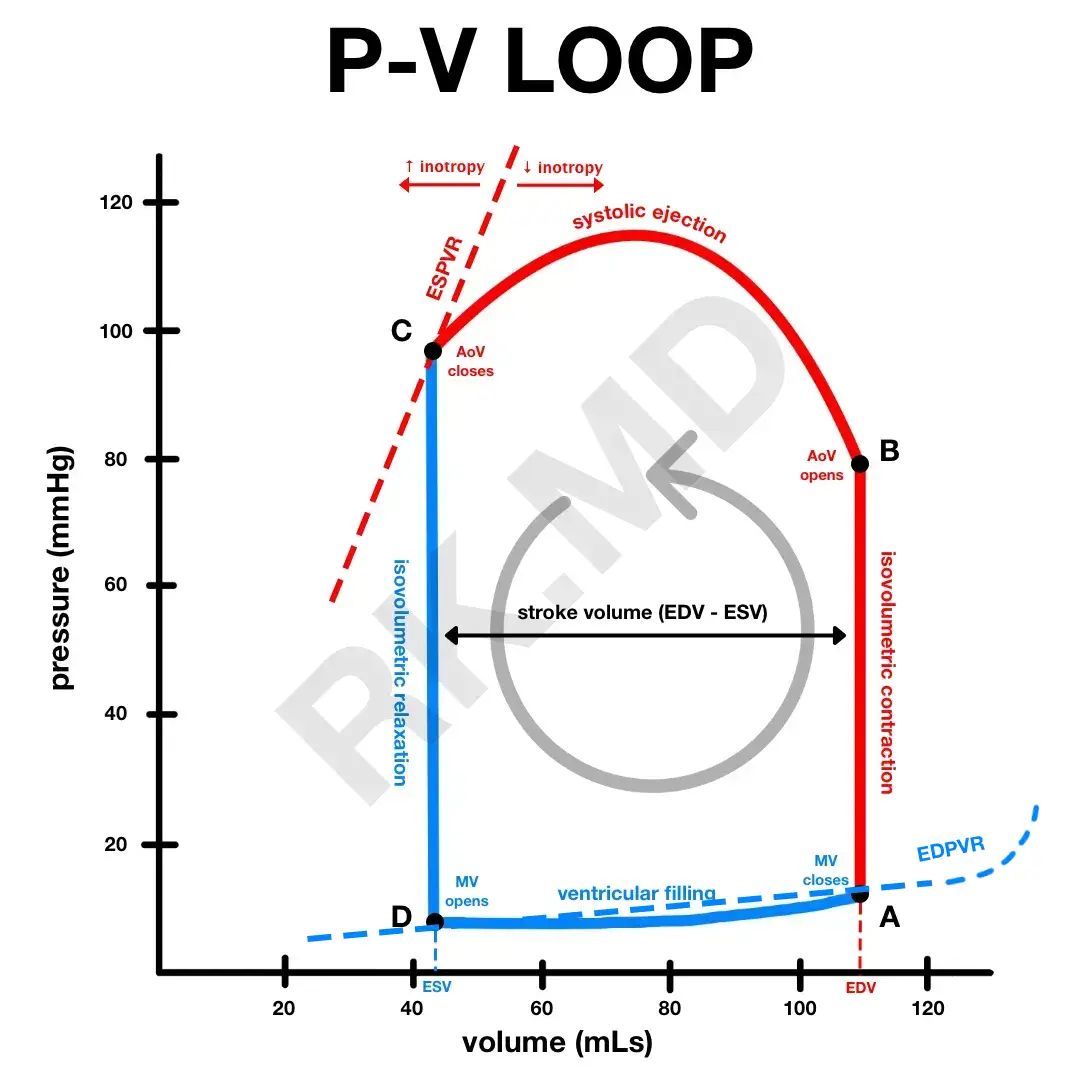
- Isovolumetric contraction (A→B) begins at end-diastole when the mitral valve (MV) closes. As the LV begins to contract, it generates pressure that is still less than the aortic pressure, so the aortic valve (AoV) remains closed.
- Systolic ejection (B→C) occurs when the aortic valve opens as the LV pressure now exceeds the aortic pressure. As blood is ejected into the aorta, the LV’s volume decreases.
- Isovolumetric relaxation (C→D) starts when the aortic valve closes (corresponds to the dicrotic notch on an arterial line waveform) and diastole begins. The ventricle begins relaxing without a volume change. This new volume (after ejection) represents the end-systolic volume (ESV).
- Ventricular filling (D→A) begins with the MV opening to allow passive blood flow into the LV, followed by an “atrial kick” and the end of diastole. At this point when the MV closes, the volume in the LV represents the end-diastolic volume (EDV). The difference in volume at end-diastole versus end-systole represents the stroke volume.
The slope of the end-systolic pressure-volume relationship (ESPVR) reflects myocardial contractility (steeper = higher contractility, flatter = less contractility). The end-diastolic pressure-volume relationship (EDPVR) provides insight into ventricular compliance such that a flatter slope implies more compliance. In other words, more volume can fill the ventricle without significantly changing the pressure.


