
Normal cardiac conduction propagates downward and leftward from the SA node to the His-Purkinje system. Thus, lead I (points to the patient’s left) and lead aVF (points straight down) represent the component vectors in the x and y planes, respectively, for the cardiac conduction axis. This means that downward is + for lead aVF, and leftward (rightward on the image) is + for lead I.
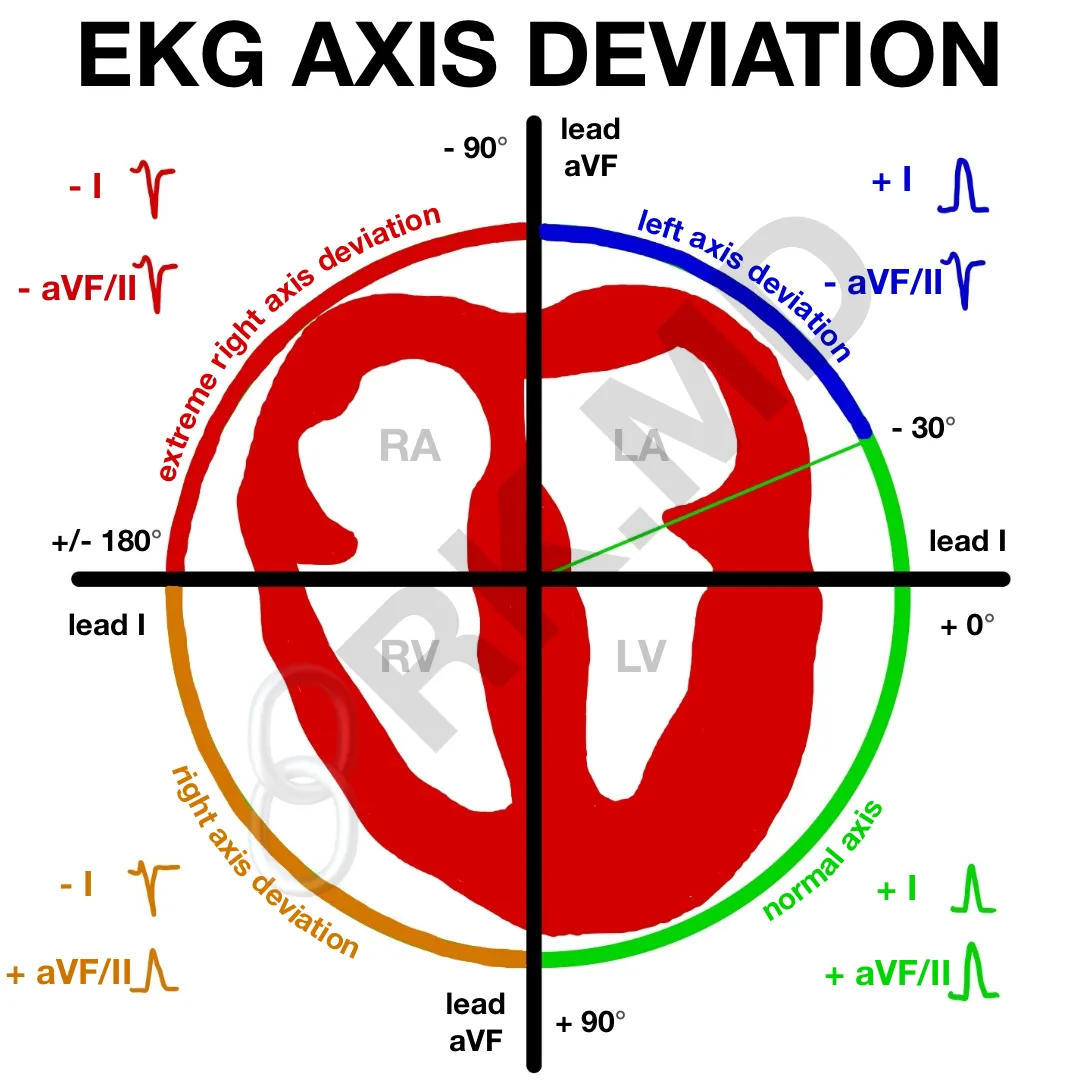
To assess the cardiac axis, determine if the QRS complexes are + or – in leads I and aVF. Then, compare your findings to the diagram:
- Normal axis: + I and + aVF/II
- Left axis deviation: + I and – aVF/II
- Right axis deviation: – I and + aVF/II
Remember, a slight leftward deviation (-30°) is still considered normal. Alternatively, lead II (which goes from the right shoulder to the left leg) is the normal cardiac conduction vector and can be used in place of aVF in the diagram. Many of us look at leads I and II from the beginning since one should look at lead II if aVF is negative.
I divide the causes of right axis deviation (+90 to +180°) into right heart strain (COPD, pulmonary hypertension, right ventricular hypertrophy, pulmonary embolism, etc.) and conduction abnormalities which favor right directional conduction (ischemic left lateral myocardium, left posterior fascicular block, left-sided WPW accessory pathway). The causes of left axis deviation (-30 to -90°) include left ventricular hypertrophy, left anterior fascicular block, and even an inferior wall myocardial infarction.
Drop me a comment below with questions!


So a sinus tachycardia with rightward axis ECG should be further looked into?
You make complex topics very easy to understand. Thank you Doctor.
Thanks for the kind words! 🙂
Thanks…Please do BBB!!
I’ll consider doing a post on this soon! 🙂
Thank you so much for your teaching, i’m an italian student of Medicine and Surgery (Brixia Universitas).
I think these teachings are very usefull and interesting.
Warm regards.
Tribbia Nicola
Appreciate the kind words, Tribbia! Best wishes to you! 🙂